The #1 FactoryTalk VantagePoint Alternative
Superior ad-hoc analytics tools, faster performance, lower cost… Just a few of the reasons dataPARC is a better choice than VantagePoint for process data visualization & analysis.
Superior Analytics Tools
There is no better toolkit for root-cause analysis & process troubleshooting
Powerful Excel Add-in
Seamless integration with Excel for advanced analysis & custom calculations
Easy SSRS Reporting
Easily connect to 3rd party SQL databases for streamlined SSRS reporting.
Delivering Process Data Analytics Solutions for 25+ Years
“Truly wonderful software for data visibility at all levels of production.”

Joseph C.
Process Engineer


Process Displays

KPI Dashboards

SPC Charts

Advanced Trending

Predictive Modeling

Reporting

Smart Alarms

Excel Add-in

Manual Data Entry
All Your Favorite Tools. And More…
Don’t abandon the tools you depend on to manage operations and troubleshoot process issues. dataPARC offers a full-featured process data management suite, with superior advanced analytics, faster performance, and at a lower overall cost.
- Build your own solutions without restrictions.
- No dependencies on Rockwell ecosystem.
- VB scripting extends platform functionality.
- Supports unlimited users on a perpetual license.
Effortless Excel Integration
dataPARC’s Excel add-in is just as powerful and user-friendly as VantagePoint’s, allowing you to seamlessly pull data into Excel for further analysis and reporting.
Whether you’re creating complex data models or simple spreadsheets, dataPARC’s Excel integration makes it easy to work with your data in the familiar Excel environment.
Request a Demo

Easy SSRS Reporting
Easily connect to third-party SQL databases and pull SSRS reports.
dataPARC’s intuitive interface simplifies the process, allowing you to generate and manage your reports with ease. No need for complicated setups or workarounds – dataPARC streamlines your reporting workflow.
Request a DemoSuperior Diagnostic Analytics
Mine richer insights from your data with dataPARC’s industry-leading set of ad-hoc root cause analysis & trending tools.
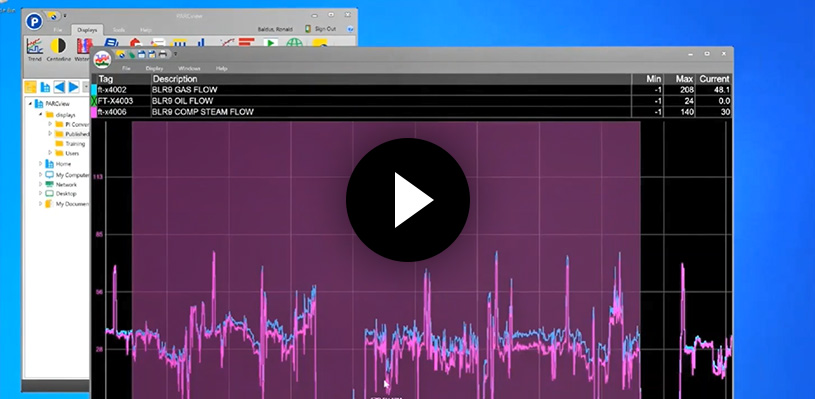
Faster Troubleshooting
How quickly can you diagnose trouble spots at your plant? It takes only 4 minutes to identify the origin of a customer’s boiler efficiency problem using dataPARC’s data visualization tools.
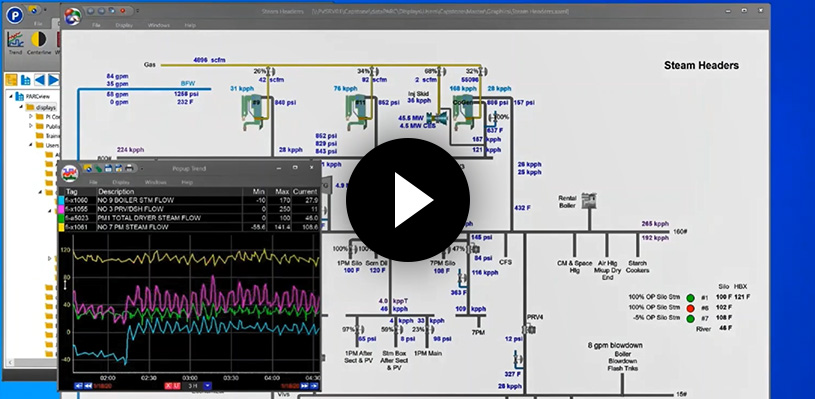
Insightful Process Displays
Optimize processes from the control room. Check out how we use system control room display to identify a problem with a pesky pressure reducing valve.
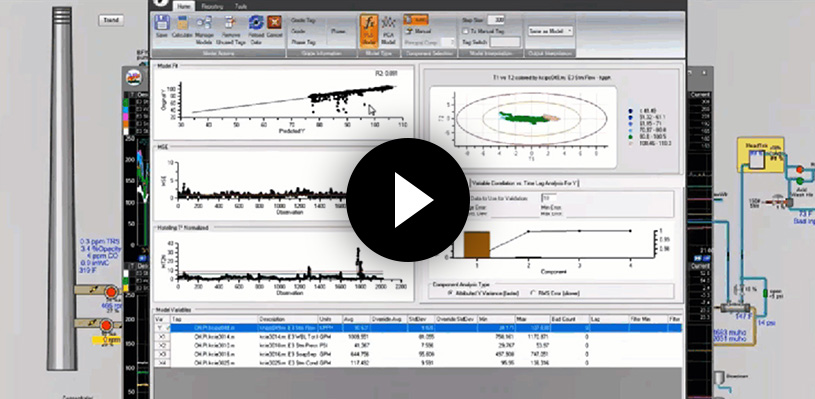
Predictive Asset Management
See how we use dataPARC’s advanced analytics tools to quickly build a predictive steam flow model to provide greater process visibility while the steam flow indicator was down.

Unleash the Power of Your Data Ecosystem
Easily integrate with various data sources within your plant to break down data silos and unlock insights across your entire manufacturing process.
- Easily integrate with third-party applications and systems
- Simple API/SDK connectivity
- Futureproof your investment
- No hidden charges for data source connections
Improve Your Data’s Performance
Speed up your data analysis capabilities. dataPARC’s proprietary high-performance archive engine connects to your time series database and returns hours, days or months of high-resolution data within seconds, so you can get right to troubleshooting.
- 200x Faster retrieval of long-term data (>30 days)
- 2x Faster retrieval of short-term data (<24hrs)
- Reduce storage. No double-storing data.


Your Process Data, Your Way
Pull up trends, displays, and dashboards in a browser or mobile device to quickly understand the real-time operating conditions at the plant, or launch dataPARC on the desktop to perform more sophisticated root cause analysis and data modeling.
- Web + Desktop applications available
- Committed to continued development of desktop platform

Your Process Data, Your Way
Pull up trends, displays, and dashboards in a browser or mobile device to quickly understand the real-time operating conditions at the plant, or launch dataPARC on the desktop to perform more sophisticated root cause analysis and data modeling.
- Web + Desktop Applications
Committed to continued development of desktop platform
PI Server Data Visualization Buyer’s Guide
Learn how to evaluate ProcessBook & PI Vision alternatives, and discover some of the best PI Server data visualization tools available today.